Sun Jan 08 2023
6 Top Picks for JavaScript Chart Libraries

Live charts, as well as static charts, are a great way to visualize data engagedly. A JavaScript chart library makes it easy to create charts and animate them, making them a powerful tool for data visualization. But what are the best JavaScript charting libraries if you want to create charts that are both visually appealing and easy to use?
Let's look at six of the best JavaScript chart libraries and see what they offer.
These libraries might be the perfect fit for you if you want to create stylish and functional charts.
Why Would You Need A JavaScript Chart Library?
There are several reasons you might want to use a JavaScript chart library. Perhaps you want to create charts that are interactive and easy to use. Maybe you need to generate charts quickly and don’t have the time or resources to create them from scratch. In any case, a good JavaScript charting library will make your life easier.
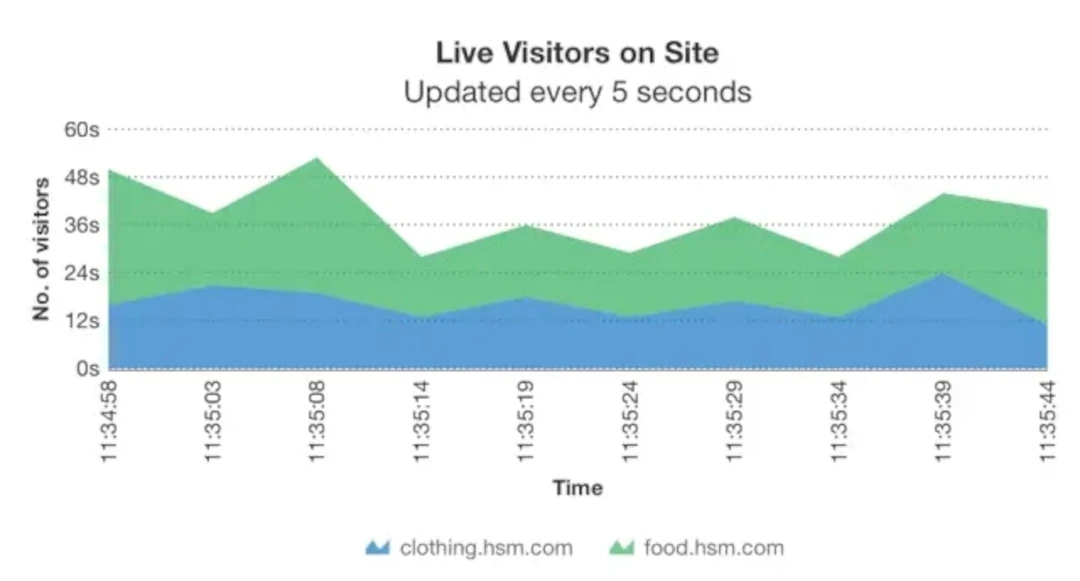
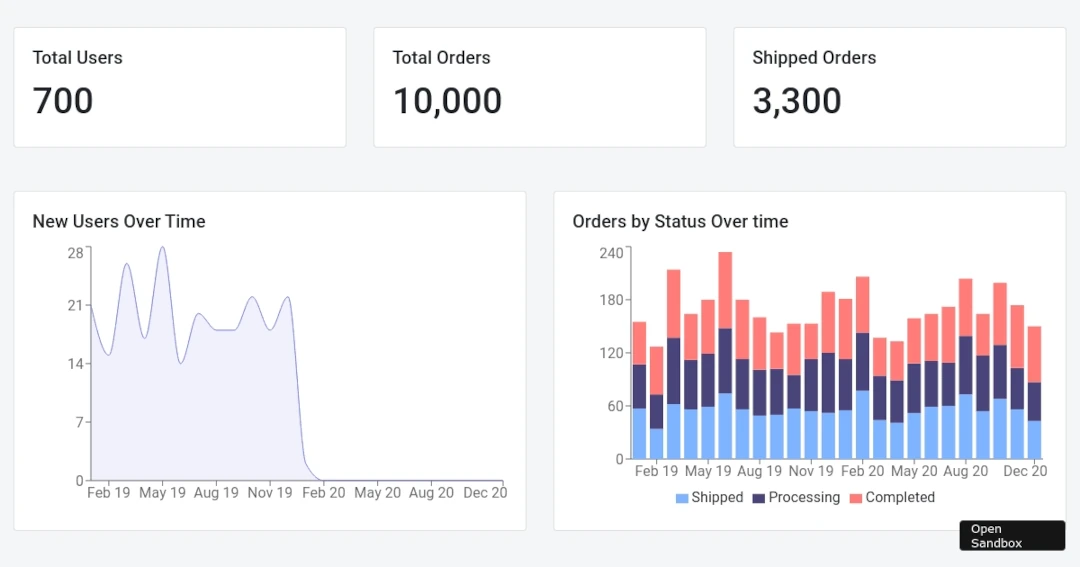
Live charts, heatmaps, and gauges are all popular uses for charting libraries. You can use these tools to visualize data in a more interesting way by simply choosing a chart from the library and customizing it to your needs.
What Are The Best JavaScript Chart Libraries?
The best JavaScript chart libraries allow you to create charts with various features and styles. Here are six of the best:
1. FusionCharts

FusionCharts is a comprehensive and powerful chart library. It has a wide range of features, including support for bar, line, area, pie, scatterplot and many others.
FusionCharts can be a Google Chart alternative if you need more features and flexibility. The dashboard and API are also great for advanced and custom integrations.
This library is perfect for those who want a high-quality and comprehensive charting library. It’s also relatively easy to use, making it a brilliant choice for beginners and experienced developers alike.
2. D3.js

D3.js is a powerful library that allows you to create interactive charts and graphs quickly and easily.
D3.js also has an extensive API, so you can create custom charts and features easily. This library is perfect for data-heavy projects, such as web applications or data visualizations.
However, it is sometimes hard to hide original data from charts using D3.js. For this reason, D3.js is not ideal for projects that need to keep sensitive data private.
3. HighCharts
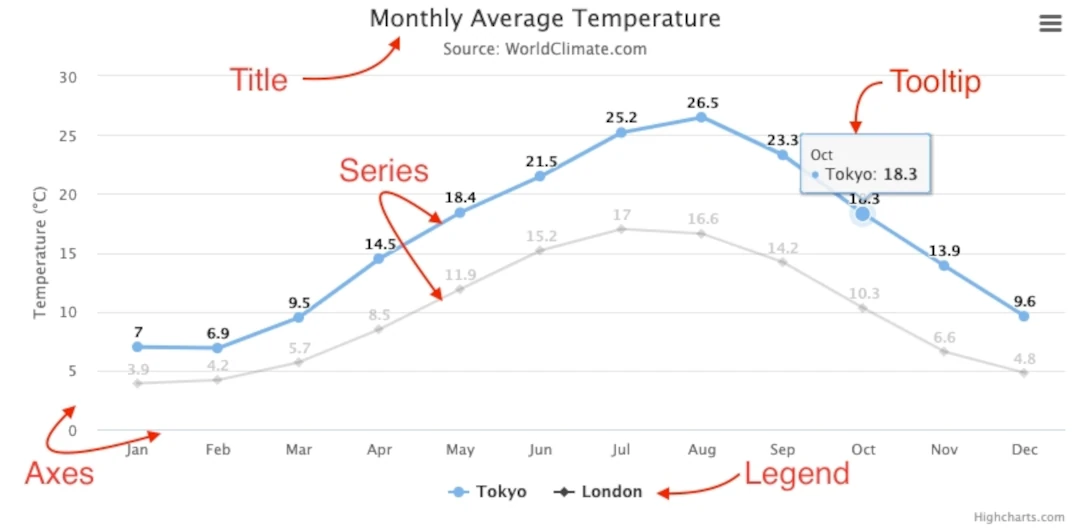
HighCharts is another popular JavaScript charting library that offers a wide range of features and options. HighCharts offer extensive customization options, making it easy to create charts that look exactly the way you want them to.
One drawback of HighCharts is the synchronization between the x axis and the y axis. This can sometimes lead to inaccurate charts. HighCharts is not as data-heavy as D3.js, so it may not be the best choice for projects that require a lot of graphics horsepower.
4. Chart.js
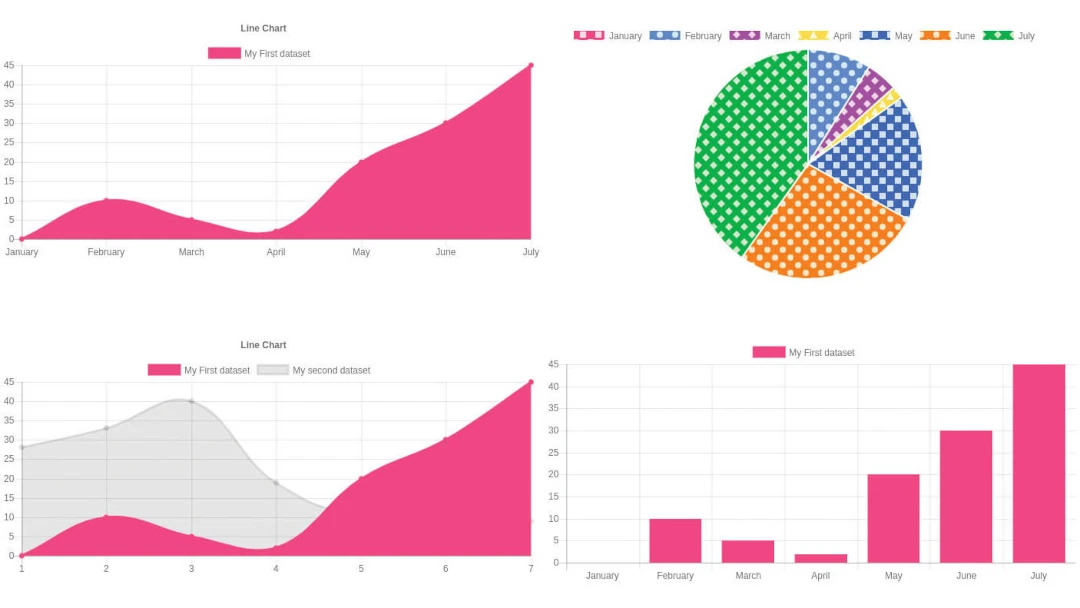
Chart.js is a comprehensive library for creating charts and graphs in JavaScript. It includes features like vector drawing, animations, and data loading/saving. It’s easy to use and comes with a lot of built-in features, making it a superb choice for advanced users.
However, Chart.js has some styling problems. It’s not as easy to customize as some of the other libraries on this list, and it’s difficult to find help if you need it.
5. Dygraphs
Dygraphs is a powerful and easy-to-use JavaScript chart library that makes creating charts fast. It has a wide range of features, including support for data binding, animations, and interactivity.
However, Dygraphs does have a few drawbacks. First, it can be slow when loading large charts. Second, it doesn’t have as many chart types as some other libraries, so you may have to use some of its features in combination with others.
6. Recharts
Recharts is a powerful JavaScript chart library that lets you create charts with a variety of features and styles. It has built-in support for data aggregation and data visualizations, making it a splendid choice for data visualization.
One drawback of Recharts is that it’s difficult to learn, but there are many resources on GitHub and elsewhere that can help you get started.
Need a Powerful, Easy-To-Use JavaScript Chart Library?
Chart libraries, graph makers, and data visualization tools are all incredibly versatile, so it’s hard to decide which one is right for you. But if you want to create informative and visually appealing charts, choose the one that fits your needs best.
FAQs
What is the best JavaScript charting library?
Different libraries are better suited for different purposes. Some libraries are better for creating charts quickly and easily, while others are better for more sophisticated charting. While FusionCharts, D3.js, and Highcharts are all popular JavaScript charting libraries, the best library for you will ultimately depend on your needs.
Is Chart.js a library?
Chart.js is an open-source library that provides a foundation for creating charts in JavaScript. The tool can create simple charts or more complex ones.
Is D3.js still relevant?
D3.js has been used to create some of the most visually appealing charts in the world, and it remains a popular option for more sophisticated charting. Despite its popularity, D3.js has limitations, and it may not be the best library for all projects.
Is CanvasJS free to use?
CanvasJS is free to use for personal and student projects. The free license has some limitations, but they are not severe.
Is D3.js hard to learn?
It is easy to learn but requires some understanding of JavaScript and the DOM. However, plenty of resources are available to help you learn D3.js if you find it difficult.